

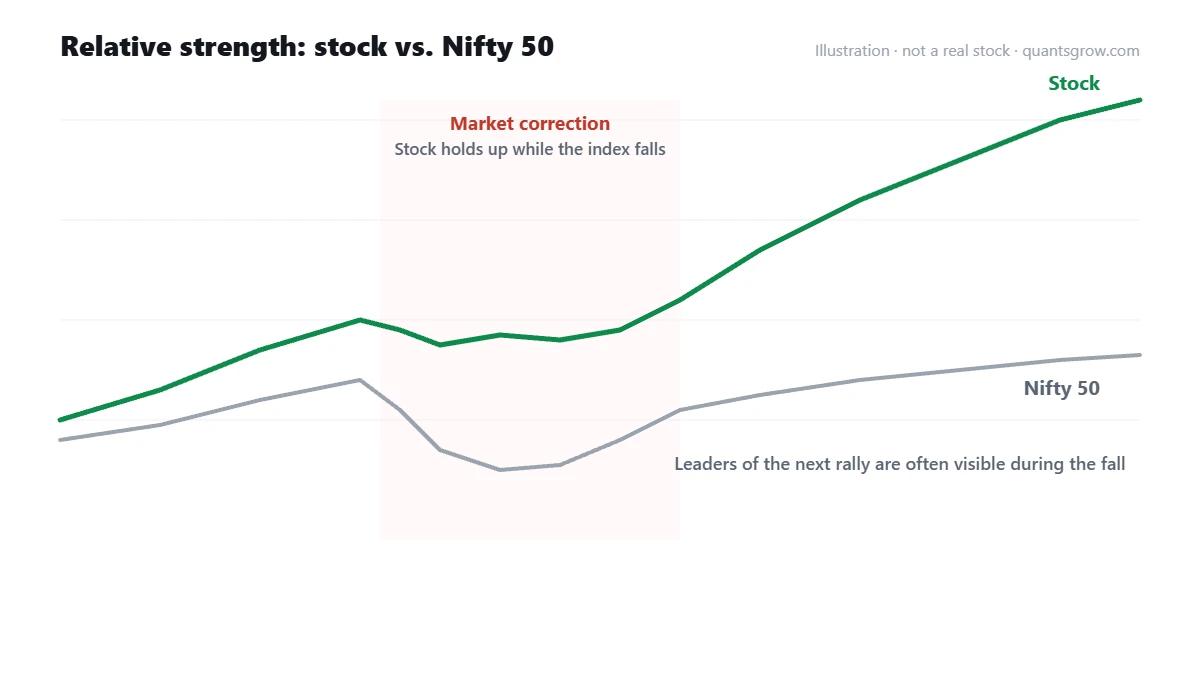
The most useful stocks to watch during a market correction are the ones that refuse to go down. The Nifty falls 8% over a month, most of your watchlist is down 15 to 20%, and a handful of names are flat or even making new highs. When the market finally turns, those are very often the stocks that lead.
That is the idea behind relative strength, or RS. This page explains what it actually measures, why it matters, the ways it can mislead you, and how to use a high RS screener as part of a real process.
RS is not RSI
This confusion comes up constantly, so it is worth clearing up first. RSI, the relative strength index, is an oscillator that compares a stock’s recent gains with its own recent losses and produces a number between 0 and 100. It says nothing about other stocks.
Relative strength, as used here, compares one stock against something else, usually the Nifty 50 or a sector index. A stock up 12% over three months while the Nifty is up 2% has strong relative strength. A stock up 12% while the Nifty is up 20% has weak relative strength, even though it went up.
Why relative strength matters
Stocks that outperform tend to keep outperforming for a while. The reasons overlap with momentum: improving fundamentals, institutions building positions gradually, and investors rotating toward what is working. RS is especially informative during corrections. A stock that holds up while the index falls is showing that its buyers are not willing to sell, even under pressure. When the pressure lifts, there is not much supply left in the way.
You can see this pattern after most meaningful corrections in Indian markets: the leaders of the next rally were very often visible as high RS names during the decline.
How to read RS sensibly
Use more than one time frame. A stock can show strong one-month RS because of one news-driven jump. Consistent outperformance over three, six and twelve months is far more meaningful than a single burst.
Look at the RS line, not just the number. Plotting the stock divided by the Nifty gives an RS line. When that line makes a new high before the price does, it is a signal many experienced traders pay close attention to.
Compare within the sector. In a strong sector rally, almost every stock in the sector beats the Nifty. The one beating its own peers is the real leader.
Check the chart is constructive. High RS stocks that are wildly extended carry the same risk as any extended stock. The best opportunities are high RS stocks sitting in a tight base, ready to break out.
See which stocks are outperforming the Nifty
The Quantsgrow High RS screener lists stocks significantly outperforming the broader market, with higher returns than the Nifty 50, which often marks the leaders in their sectors. You can filter by index universe and sort by RS, sector or recent returns to see where the strength is concentrated.
View high RS stocks → Opens the live screener in the Quantsgrow app.Where high RS goes wrong
Relative strength can be manufactured by things that do not last: a one-off order win, an index inclusion, or a short squeeze. It can also be a symptom of very low liquidity, because thinly traded stocks often simply do not move when the market falls, and that inactivity reads as “strength”.
Defensive sectors deserve a separate note. During sell-offs, FMCG and pharma stocks often show high RS simply because they fall less. That is real information, but it does not mean they will lead the next rally. Leadership in a recovery usually comes from growth names that held up unusually well, not from stocks that are defensive by nature.
Combining RS with other scans
RS works best as a filter on top of something else. High RS plus a VCP is a classic combination: a leader quietly tightening up. High RS plus new all-time highs often marks the market’s true leaders, and a weekly inside bar in a high RS stock can offer a tight, low-risk entry. And RS is one of the core pillars of the CANSLIM approach, the “L” for leader.
Frequently asked questions
What does high RS mean in stocks?
High RS means high relative strength: the stock has outperformed a benchmark, usually the Nifty 50, over a recent period. It identifies stocks that are stronger than the market as a whole.
What is the difference between RS and RSI?
RS compares a stock’s performance with another benchmark such as the Nifty. RSI is an oscillator that compares a stock’s recent gains with its own recent losses. They measure different things and are often confused.
Is a high RS stock a buy signal?
No. High RS is a filter that points to strong stocks. You still need a proper entry, such as a breakout from a base or a pullback to support, and a defined stop-loss.
Which period should I use for relative strength?
Many traders look at three, six and twelve-month performance together. Consistent outperformance across several periods is more reliable than strength in just one.
Why do high RS stocks matter during a correction?
Stocks that hold up while the market falls show that their holders are reluctant to sell. When the market recovers, these stocks often have less overhead supply and tend to be among the first to make new highs.
The takeaway
Relative strength is a simple question: is this stock doing better than the market? Asked consistently, and especially during difficult markets, it is one of the most reliable ways to separate leaders from laggards. Use it to decide what to watch, then let the chart decide when to act.
This page is for educational purposes only and is not investment advice or a recommendation to buy or sell any security. Investments in the stock market are subject to market risks. Examples are illustrative and do not refer to any specific stock unless clearly stated. Please do your own research and consider your risk tolerance before making any investment decision.