

Most chart patterns are common enough that you will see a handful every week. The high tight flag is not one of them. A genuine one requires a stock to roughly double in a couple of months and then barely pull back at all. When that happens, it is one of the strongest statements of demand a chart can make, and it is also one of the easiest patterns to misread.
This page explains the classic high tight flag, the looser “high tight setups” traders more commonly find, how to tell either apart from an exhausted spike, and how to manage a trade in a stock that has already moved this much.
Anatomy of the pattern
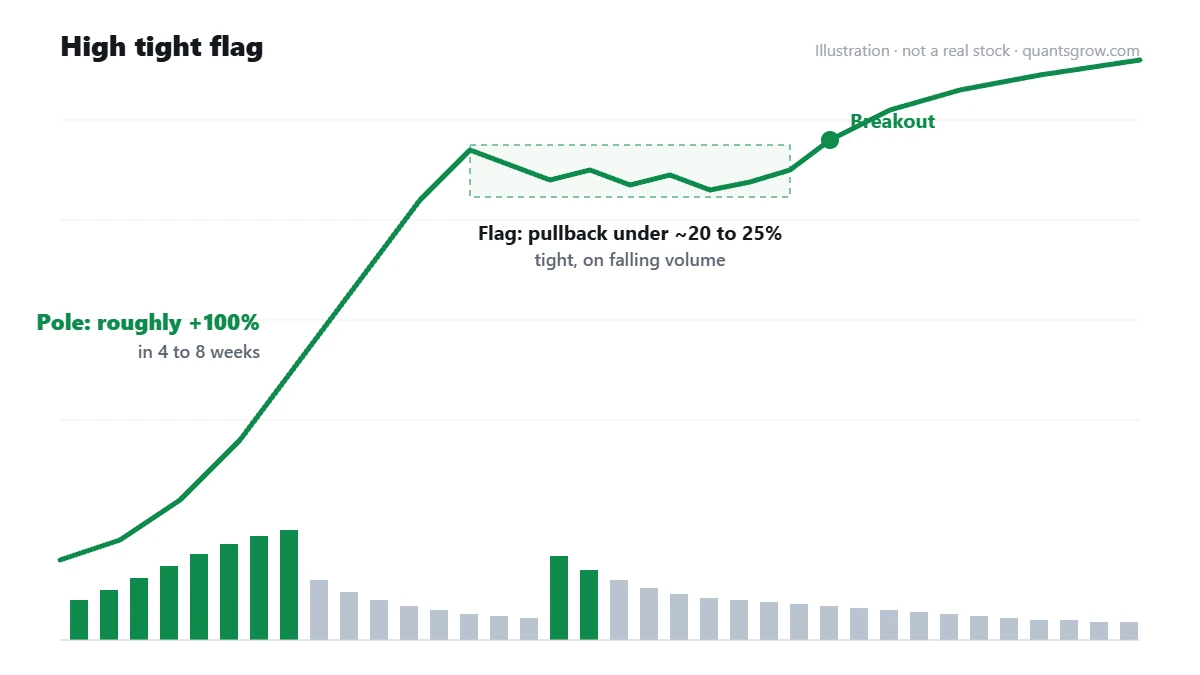
The pole. A sharp, sustained advance, usually driven by a fundamental catalyst such as a big order win, a new business line, a sector re-rating or a major earnings surprise. In the textbook version, the stock roughly doubles within about two months.
The flag. Instead of giving back a large chunk of the gain, the stock drifts sideways or slightly lower in a tight range. The key word is tight. A stock that has just doubled would normally see heavy profit-taking. When the pullback is shallow and volume dries up, it tells you holders are not willing to sell even at a large profit.
The breakout. Price moves out of the top of the flag, ideally on rising volume, and the next leg begins.
Why it is so rare
The combination is unusual. Big moves usually attract big profit-taking, so a 100% rally followed by a 30 to 40% correction is far more normal. The high tight flag requires both an exceptional rally and exceptional holding behaviour afterwards. In India, these tend to cluster during strong broad markets and around powerful sector themes, when a few stocks in the hottest group behave this way.
Because the strict version is so rare, most traders and screeners work with a broader definition: a stock in a strong uptrend with minimal pullbacks, trading tightly near its highs, with consistent buying pressure. That captures the spirit of the pattern while producing enough candidates to be useful.
High tight flag or blow-off top?
The pole of a high tight flag and the final leg of a climax top can look identical. What follows is what separates them.
After a climax top, the stock usually reverses sharply on heavy volume. It might drop 15% in two days, and the range keeps widening. After a high tight flag pole, the range narrows, volume fades, and the stock holds near the highs. If the “flag” is getting wider and the down days come on heavy volume, it is not a flag.
Context helps too. A stock that doubled on a genuine change in its business is a better candidate than one that doubled on rumours, operator activity or a tiny float.
Scan for high tight setups on NSE
The Quantsgrow High Tight Setup screener looks for stocks in a strong uptrend with minimal pullbacks, tight price action near their highs, and consistent buying pressure. These are the conditions a continuation move grows out of. Use the list to find candidates, then check each chart for a clean pole and a genuinely tight flag.
View high tight setups → Opens the live screener in the Quantsgrow app.Managing the trade
The obvious challenge is that you are buying something that has already doubled. That is psychologically difficult, and it is why position sizing matters more than usual. The stop sits just below the low of the flag. In a tight flag that might be 8 to 12% below the entry, wider than a typical VCP stop, so size the position smaller to keep the rupee risk the same.
These stocks are volatile in both directions. When they work, the next leg can be large. When they fail, they often fail hard, so honouring the stop is not optional.
Liquidity is worth a separate check. A smallcap that doubles on thin volume can produce a pattern that looks perfect on the chart but is driven by very little money. The best high tight flags tend to come in stocks with real institutional participation and steadily rising traded value.
Frequently asked questions
What is a high tight flag pattern?
A high tight flag is a bullish continuation pattern where a stock rises roughly 90 to 100% or more in about four to eight weeks, then consolidates for a few weeks with a shallow pullback of no more than about 20 to 25%, before breaking out to new highs.
How is a high tight flag different from a regular bull flag?
A regular bull flag follows a smaller advance and can appear in many stocks. A high tight flag requires an exceptionally strong prior move, roughly a doubling, and an unusually shallow consolidation, which is why it is much rarer.
Where should the stop-loss be on a high tight flag?
Most traders place it just below the lowest point of the flag. Because these stocks are volatile, the stop may be wider than for other setups, so position size should be reduced to keep the overall risk in check.
Are high tight flags common in Indian stocks?
True textbook examples are rare anywhere, including India. Looser high tight setups, strong uptrends with tight action near highs, are more common and typically appear during strong markets and sector rallies.
In short
The high tight flag is the market’s way of showing that a stock’s holders refuse to sell even after an enormous gain. When the pole is driven by something real and the flag is genuinely tight, it can precede some of the biggest moves you will see. When the “flag” is loose and volume is heavy, it is usually a top. Check candidates against momentum and all-time-high lists, where the strongest of them often appear first.
This page is for educational purposes only and is not investment advice or a recommendation to buy or sell any security. Investments in the stock market are subject to market risks. Examples are illustrative and do not refer to any specific stock unless clearly stated. Please do your own research and consider your risk tolerance before making any investment decision.