

Most people are taught to buy low. Momentum traders do something that feels wrong at first: they buy stocks that have already gone up, on the theory that strength tends to continue for longer than anyone expects. Uncomfortable as it is, there is a large body of evidence behind it, in India as much as anywhere.
This page is about momentum stocks in India from a practical point of view: what momentum actually looks like on an NSE chart, why it persists, how to avoid buying the exact top, and how to use a momentum screener without turning it into a list of things that have already finished moving.
What momentum looks like on a chart
Forget the formulas for a moment. A stock in genuine momentum has a particular look. Its pullbacks are short and shallow, often just a few days. It keeps finding buyers at or above its 20 or 50-day moving average. The up days come with noticeably more volume than the down days. And when the Nifty has a bad week, it holds up or barely flinches.
What it does not look like is a single huge green candle. A stock that jumps 18% on a results day has a price spike. Whether it has momentum depends on what happens over the next several weeks, when the news is old and the stock still has to find fresh buyers.
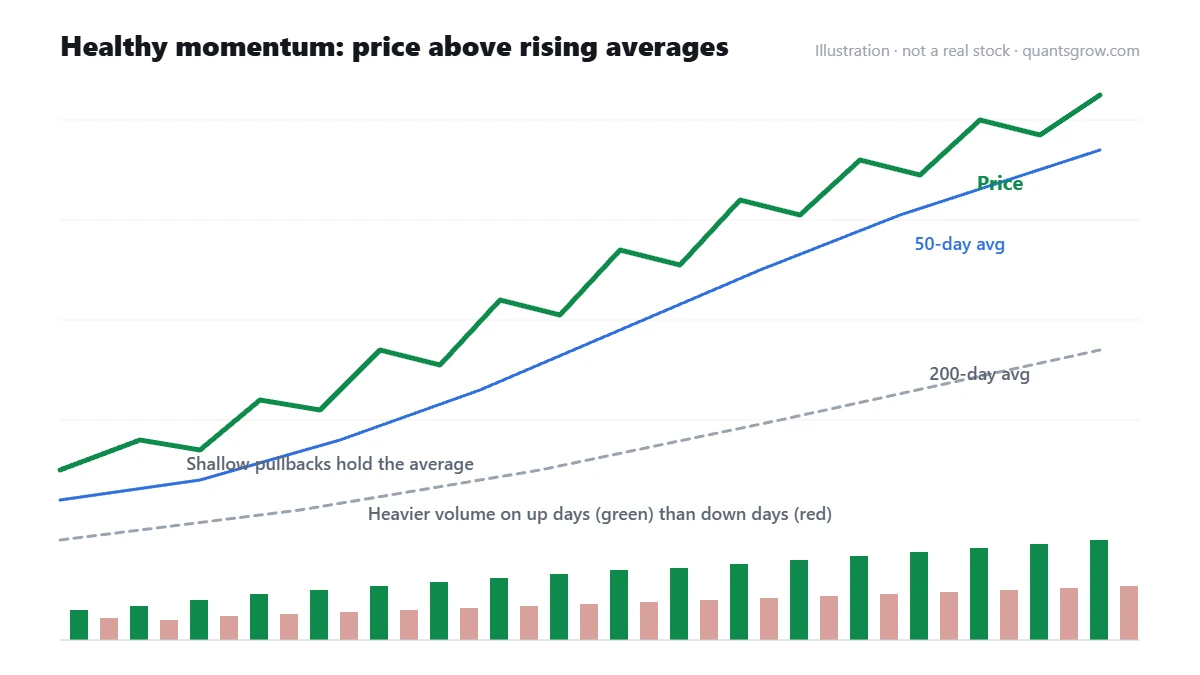
Why momentum persists
The usual explanation is that information spreads slowly. A business starts doing better, earnings upgrades arrive one quarter at a time, mutual funds build positions over weeks rather than days, and each new buyer pushes the price a little further. Retail investors who sold early often buy back higher. None of this happens in one session, which is why trends in stocks like the defence, capital goods and power names during their big runs lasted for many months rather than days.
Momentum also has a well-known weakness. When it reverses, it tends to reverse hard, because the same crowded positioning that pushed the price up now rushes for the exit together.
How to judge whether momentum is healthy
A few questions help separate a strong, durable trend from one that is running on fumes.
Is it accelerating or stretching? Steady gains with regular pauses are healthier than a near-vertical move. A stock that is 40% above its 50-day average has very little room for error, even if the trend is real.
What does volume say? In a healthy trend, pullbacks come on lighter volume. If the stock starts falling on the heaviest volume of the move, that is often institutions distributing.
Is the sector with it? A momentum stock whose peers are also trending is part of a broader rotation, and those tend to last longer. A lone stock rising while its sector bleeds deserves a closer look at why. (Checking relative strength against both the Nifty and the sector is useful here.)
Where is the market? When the Nifty and the broader indices are trending up, momentum strategies have the wind behind them. In a falling market the strongest stocks are often the last to fall, and when they do fall, they fall quickly.
Entering without buying the top
The hardest part of momentum trading is entry. The stocks look best when they are most extended, which is exactly when the risk is highest. Experienced traders tend to wait for one of a few lower-risk moments.
The first is a pullback to a rising moving average, typically the 20 or 50-day, that holds on light volume. The second is a tight consolidation that forms after a strong run, often a VCP or tight flag, followed by a breakout to new highs. Both give you a nearby level where you know you are wrong, instead of a vague hope that the trend continues.
What they do not involve is chasing a stock that has gone up 12% in three sessions because it appeared on every scan that morning.
Find momentum stocks on NSE today
The Quantsgrow momentum screener looks for the traits described above: consistent gains, price acceleration, stronger volume on up days than down days, and price trending above key moving averages. You can narrow it to the Nifty 50, Nifty 500, Midcap 150 or Smallcap 250 universe and sort by relative strength or recent returns, so the strongest names rise to the top.
Find momentum stocks → Opens the live screener in the Quantsgrow app.Exits matter more than entries
Momentum traders who last tend to be obsessive about exits. A trend can end without warning, so you need a rule before you need it.
Some common approaches: exit on a close below the 50-day moving average; trail a stop under the most recent swing low; or sell part of the position into a sharp, extended run and trail the rest. None is perfect. A tight exit gets shaken out of good trends, and a loose one gives back a lot of profit. What matters is picking one that fits how often you check your positions, and then following it.
The one approach that consistently fails is having no exit at all and turning a momentum trade into a long-term investment because it is now down 25%.
Common mistakes with momentum stocks
Treating news spikes as momentum is the most common. So is ignoring liquidity. A smallcap that trades a few lakh rupees a day can show spectacular momentum on a chart and still be impossible to exit cleanly. Another mistake is holding too many at once in the same theme. When ten of your stocks are all railway or PSU names, you have one position, not ten.
And finally, judging the strategy on a single month. Momentum has long losing streaks when markets chop sideways. Traders who abandon it after three bad weeks often miss the stretch where it pays for the whole year.
Frequently asked questions
What are momentum stocks?
Momentum stocks are shares whose prices have been rising faster and more consistently than the broader market, typically trading above rising moving averages with stronger volume on up days. Momentum traders buy them on the expectation that strength continues for a while, and exit when the trend breaks.
Does momentum investing work in India?
Momentum effects have been widely documented in Indian equities, and NSE now publishes momentum indices such as the Nifty200 Momentum 30. That said, momentum has sharp drawdowns when markets reverse, so position sizing and exit rules matter as much as stock selection.
How do I find momentum stocks for today?
You can scan for stocks above rising 50 and 200-day moving averages with strong recent returns and relative strength against the Nifty. A momentum screener such as the one in the Quantsgrow app does this daily, after which you should check each chart for extension, volume and sector support.
What is the best time frame for momentum trading?
Many swing traders use daily charts with holding periods of a few weeks to a few months. Positional momentum strategies often rebalance monthly. Very short-term intraday momentum is a different game with different risks.
When should I sell a momentum stock?
Decide before you buy. Common exits include a close below the 50-day moving average, a break of the most recent swing low, or a trailing stop. The important thing is a rule you actually follow when the trend turns.
Where momentum fits
Momentum is less a pattern than a filter. It tells you where the strength is. The setups that tend to work best are found inside that strength: tight consolidations in leading stocks, breakouts with volume, and names that keep making new highs while the rest of the market hesitates. A momentum scan is a good way to find the leaders. What you do with them, and how you get out, is what decides the result.
This page is for educational purposes only and is not investment advice or a recommendation to buy or sell any security. Investments in the stock market are subject to market risks. Examples are illustrative and do not refer to any specific stock unless clearly stated. Please do your own research and consider your risk tolerance before making any investment decision.