
Price can be pushed around by a few orders. Volume is harder to fake. When a stock that normally trades two lakh shares a day suddenly trades fifteen lakh, someone with real money has made a decision, and it is usually worth knowing about before the rest of the market catches on.
That is the case for watching volume breakout stocks. This page covers what a volume breakout actually signals, how to read the difference between accumulation and noise, and how to use a volume scan without mistaking every spike for a buy signal.
Why volume comes first
Large investors cannot buy quietly. A mutual fund building a position in a midcap needs weeks, and even then its footprints show up as days of above-average volume on up moves and light volume on pullbacks. Often the volume shows up before the price does much. The stock might rise only 2% on a day that trades four times its usual volume, which is an easy day to overlook if you only watch price.
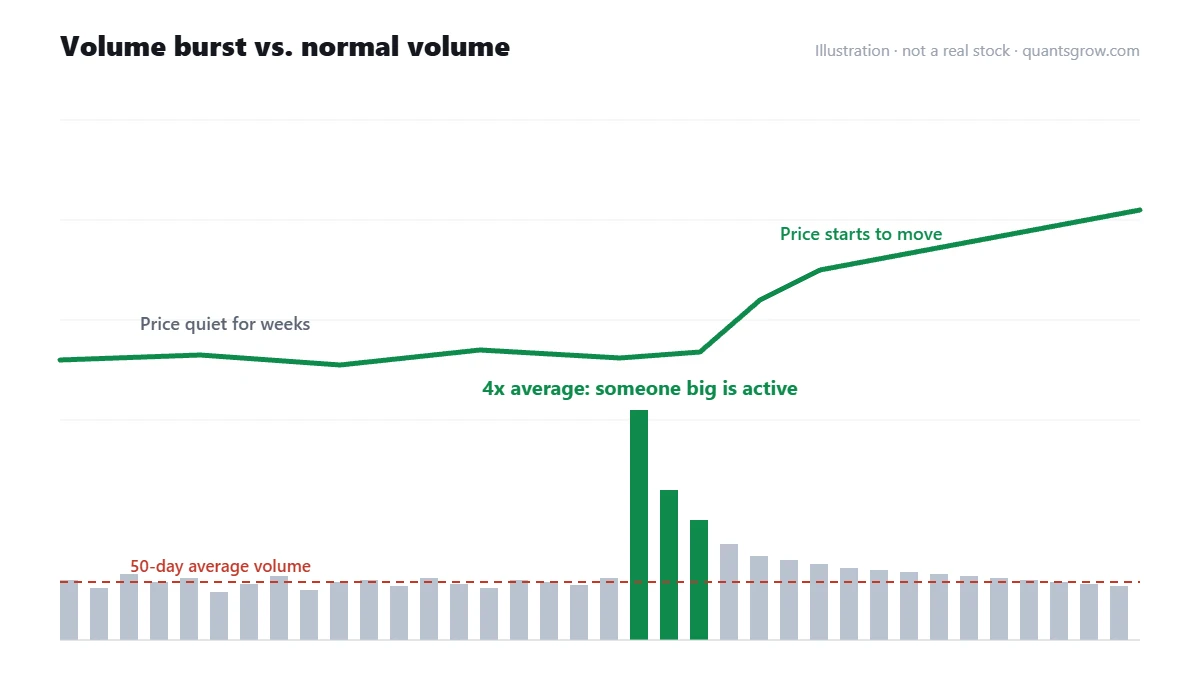
That is the real use of a volume scan: spotting the moment a quiet stock starts attracting serious participation, while it is still near a reasonable entry.
Reading a volume spike
Not all volume is equal. The same spike can mean very different things depending on where it happens and what price does.
High volume, price closes near the high, breaking out of a base. This is the classic bullish volume breakout. Demand overwhelmed supply at a level that had held before.
High volume, price closes near the low. This is the opposite: heavy selling, often distribution. If it happens after a long run-up, it is frequently an early warning.
High volume, long upper wick, price closes in the middle. Buyers pushed it up and sellers took it back. That is churn, and it often marks a stalling point rather than a launch.
High volume on a news day. Results, block deals, index inclusions and corporate actions all produce volume spikes. Some start new trends. Many are one-day events that fade. Check what happened before you read anything into it.
Accumulation versus a one-off spike
The most reliable signal is rarely a single day. It is a pattern of several high-volume up days over a few weeks, with the down days in between on noticeably lighter volume. Analysts sometimes call these volume footprints. A stock that shows this while holding near the top of its range is being accumulated, even if the price has not broken out yet.
A single enormous spike with nothing before or after it is much harder to trade. It might be a block deal between two funds, an index rebalance, or a circular trade. Without follow-up volume, it often goes nowhere.
Find unusual volume on NSE every day
The Quantsgrow Volume Burst screener flags stocks with sudden spikes in trading volume, the kind that often point to institutional activity. Its Volume Footprints view looks for the repeated, quieter build-up of volume that tends to show up before a move. Use the burst list for fresh events and the footprints list to spot accumulation in progress.
See volume breakout stocks → Opens the live screener in the Quantsgrow app.Turning a volume signal into a trade
The volume spike tells you where to look. The trade still needs a setup. Most traders who use volume well combine it with a chart pattern, for example a stock breaking out of a VCP or triangle on the heaviest volume in months. The pattern gives the entry and the stop, and the volume gives confidence that the move has fuel.
If the stock has already run 8 or 10% on the spike day, it is often better to wait. Strong volume breakouts frequently pull back toward the breakout level within a few sessions on much lighter volume, which can be a lower-risk entry than buying the spike itself.
Volume traps specific to Indian markets
Low-priced and illiquid stocks can show huge percentage volume jumps on very little money. A stock that normally trades ₹10 lakh a day and suddenly trades ₹60 lakh has had a 6x volume day, but that is still a tiny amount of capital, easily moved by a small group. Always look at traded value in rupees, not just share count.
Watch the exchange surveillance frameworks too. Stocks under ASM or GSM measures, or moved to the trade-for-trade segment, often show erratic volume that has nothing to do with genuine demand.
Frequently asked questions
What is a volume breakout in stocks?
A volume breakout is when a stock trades far more shares than its recent average, often two or more times its 50-day average volume, usually alongside a significant price move. It indicates that large participants are active in the stock.
Is high volume bullish or bearish?
Neither on its own. High volume with a strong close near the day’s high, especially out of a base, is usually bullish. High volume with a close near the low, particularly after a long rally, is often bearish. Read volume together with price.
How much volume is needed for a valid breakout?
There is no fixed rule, but many traders look for at least 1.5 to 2 times the 50-day average volume on the breakout day. Higher is generally better, as long as it is not driven by a one-off event.
What are volume footprints?
Volume footprints refer to a pattern of repeated above-average volume on up days, with lighter volume on down days, over several weeks. It suggests gradual accumulation by larger investors before a bigger price move.
Where can I find high volume stocks today?
Exchange websites publish most-active lists, but those are dominated by large caps. A volume scan relative to each stock’s own average, such as the Quantsgrow Volume Burst screener, is more useful for spotting unusual activity in midcaps and smallcaps.
In short
Volume is the market telling you that something changed. It does not tell you what. Read the spike in context, prefer steady accumulation over one-off bursts, check traded value rather than share count, and let a proper chart setup decide your entry and exit. Volume scans pair especially well with high RS lists, since a stock that is both outperforming and seeing rising participation is often where the next leaders come from.
This page is for educational purposes only and is not investment advice or a recommendation to buy or sell any security. Investments in the stock market are subject to market risks. Examples are illustrative and do not refer to any specific stock unless clearly stated. Please do your own research and consider your risk tolerance before making any investment decision.