

Every trader has bought a breakout at 10 a.m. and watched it fall back into the range by lunch. Every trader has also skipped one because it “looked extended” and then watched it run 30%. Breakouts are simple to describe and genuinely hard to trade, mostly because the good ones and the traps look almost identical on the day.
This guide covers breakout stocks in India: what a breakout actually is, the conditions that make one more likely to hold, the patterns behind them, and how to use a breakout screener as a shortlist rather than a signal service.
What a breakout really is
A resistance level is simply a price where sellers have shown up before. Each time the stock rallies to ₹1,250, someone sells, and it backs off. A breakout is the day buyers absorb all of that supply and close the stock above the level. It matters because the sellers who were waiting at ₹1,250 are now gone, and the people who missed it are suddenly buyers.
That last point is also why breakouts fail. If the buying was a few large orders rather than broad demand, there is nobody behind them, and the stock slides back below the level. The people who bought the breakout then become the new sellers.
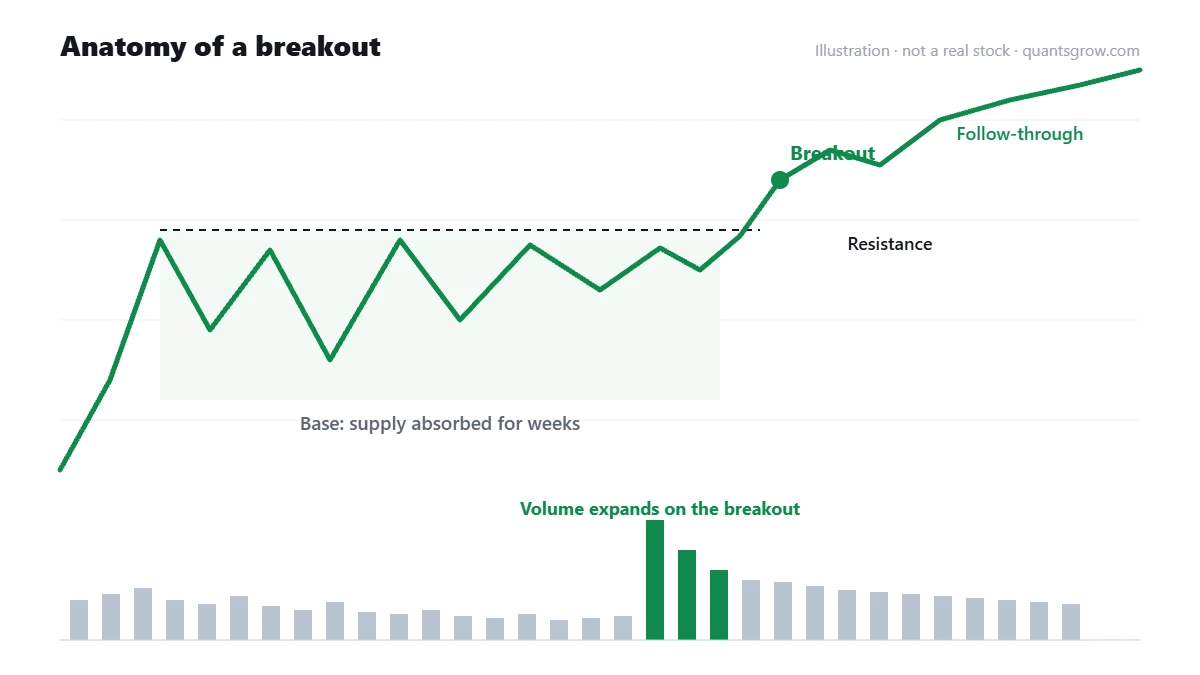
The four parts of a breakout worth trading
A real base. The stock should have spent weeks, not days, building a range. Longer bases absorb more supply. Bases where the price swings get tighter toward the right side, like a VCP, are generally better than wide, sloppy ones.
A prior uptrend. Breakouts from a base that sits above rising 50 and 200-day averages carry the existing trend behind them. A “breakout” from a long downtrend is a different trade with much lower odds.
Volume expansion. This is the closest thing to a lie detector. A breakout on 2 or 3 times the average daily volume tells you real money is involved. A breakout on ordinary volume is a coin toss. (This is exactly what a volume breakout scan looks for.)
Follow-through. The day after the breakout tells you a lot. Good breakouts usually hold above the old resistance and often keep going. Ones that immediately give back most of the move deserve suspicion.
Triangle breakouts
Triangles are one of the most common shapes a base takes, and they come in three flavours.
An ascending triangle has a flat top and rising lows. Buyers keep stepping in at higher prices while sellers defend the same level, and eventually the sellers run out. These tend to break upward more often than the other two, though not reliably enough to bet on blindly.
A descending triangle is the mirror image: flat support with falling highs. It shows sellers getting more aggressive, and it more often resolves downward.
A symmetrical triangle has both lines converging. It shows indecision, and the direction of the eventual break matters more than the pattern itself.
In all three, volume normally contracts as the triangle narrows. The break out of it should come with volume expanding again.
Scan for breakout stocks across NSE
Quantsgrow has two scans built for this. Triangle Breakouts looks for ascending, descending and symmetrical triangles where volume contracted during the formation and price is breaking out with volume expansion. Volume Burst flags sudden spikes in trading volume, which is often the first sign a base is resolving. Start with the triangle scan and cross-check with Volume Burst.
View breakout stocks → Opens the live screener in the Quantsgrow app.Why most breakouts fail, and how to stay out of the bad ones
Failed breakouts are normal. Even in good markets, a large share of breakouts stall or reverse. The goal is not to avoid failures entirely but to keep them small and to stack the odds a little in your favour.
Breakouts fail most often when the broader market is weak, when the base is too short or too loose, when volume does not expand, or when the stock was already extended before it “broke out”. In India, a few local factors add to this. Stocks near results dates can gap either way. Smaller names in tighter price bands can lock at the upper circuit, which leaves late buyers chasing the next morning’s gap. And thinly traded stocks can break out on very little actual money.
Managing a breakout trade
The appeal of a breakout is that the stop is obvious. If the stock breaks out above ₹1,250 and you buy at ₹1,265, a close back below the base or below the last tight range tells you the breakout failed. That might be ₹1,190, around 6% risk. Size the position so that 6% costs a fixed, small part of your capital.
Some traders also use a time stop: if a breakout has not made progress within a week or two, they exit and redeploy. The best breakouts usually work quickly. The ones that drift sideways after breaking out often end up failing.
Breakouts versus chasing
There is a difference between buying a breakout and buying something that has broken out. The first happens close to the pivot, with a defined risk. The second happens 10% above it, with no logical stop. Breakout scans that update end-of-day will naturally show stocks a day after the move. Use them to build a watchlist of names to buy on a pullback to the breakout level or a tight pause, rather than as an instruction to buy at any price the next morning. A weekly inside bar forming just under the pivot is one of the more precise ways to time that entry.
Frequently asked questions
What is a breakout stock?
A breakout stock is one that has moved decisively above a resistance level, typically the top of a trading range or chart pattern, often on higher-than-usual volume. Traders watch these because the move can signal that selling pressure at that level has been absorbed.
How do I confirm a breakout?
Look for a close above the resistance level rather than just an intraday high, trading volume well above average, a well-formed base beforehand, and the stock holding above the level over the following sessions. A healthy overall market also improves the odds.
Which triangle pattern is most bullish?
The ascending triangle, with a flat top and rising lows, is generally considered the most bullish because it shows buyers stepping in at higher prices. Even so, the direction of the actual break and the volume behind it matter more than the shape.
Why do breakouts fail?
Common reasons include weak overall market conditions, low volume on the breakout, a short or loose base, the stock already being extended, and event risk such as quarterly results. Failed breakouts are a normal part of trading, which is why a defined stop-loss matters.
Can I find breakout stocks for today on NSE?
Yes. End-of-day scans such as the Quantsgrow Triangle Breakouts and Volume Burst screeners list stocks that are breaking out or showing volume spikes. Review each chart before acting, since scans cannot judge base quality or news.
The short version
The breakouts worth trading come from stocks already in an uptrend, out of a proper base, on real volume, in a market that is not falling apart. Use scans to find them, use the chart to reject the weak ones, and use a stop to limit the damage from the ones that fail anyway. Pair the breakout list with momentum and relative strength to focus on the leaders.
This page is for educational purposes only and is not investment advice or a recommendation to buy or sell any security. Investments in the stock market are subject to market risks. Examples are illustrative and do not refer to any specific stock unless clearly stated. Please do your own research and consider your risk tolerance before making any investment decision.