

CANSLIM is one of the few stock-picking methods that asks you to look at both the business and the chart, and to insist on both being strong at once. William O’Neil built it by studying the biggest winning stocks in US market history and asking what they had in common before their major moves. The answer was a mix of accelerating earnings, institutional buying and price leadership, usually during a healthy market.
The method translates to India surprisingly well, with a few adjustments. This page walks through each letter as it applies to NSE stocks, the places it needs adapting, and how to use a CANSLIM screener as a starting point.
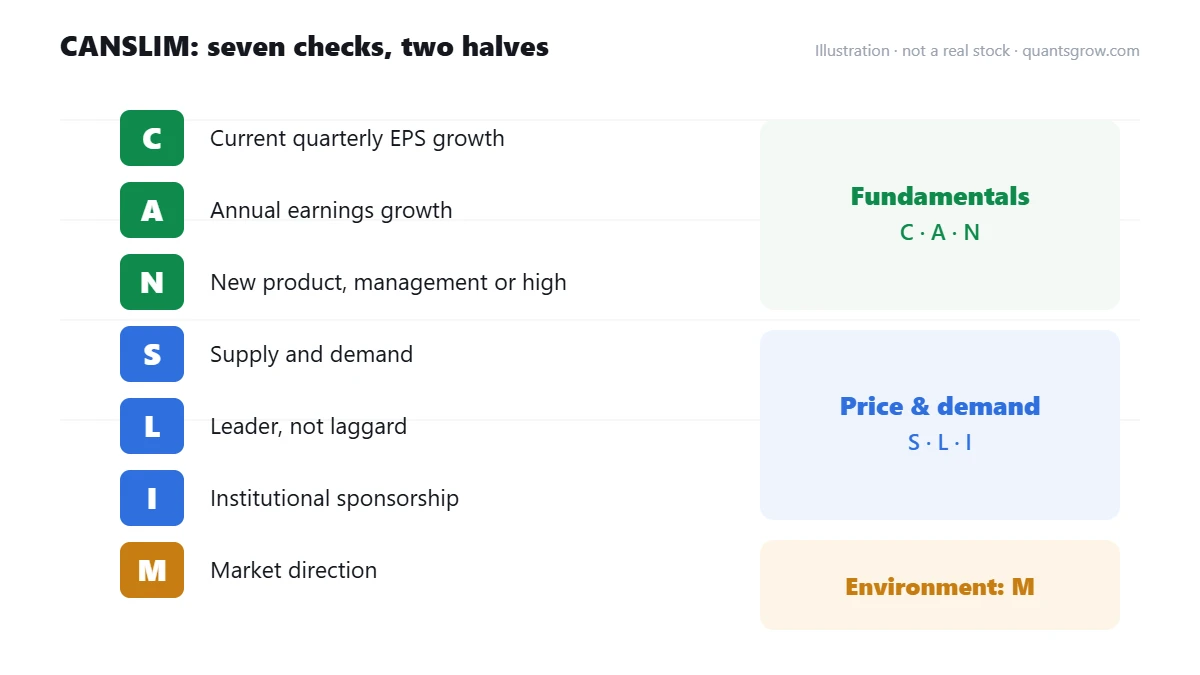
The seven letters, applied to Indian stocks
C: Current quarterly earnings. O’Neil looked for quarterly EPS growth of at least 20 to 25% over the same quarter a year earlier, and more if it is accelerating. In India, check that the growth is operating growth, not a one-time gain from selling a property or a tax write-back. Results season makes this easy to track because nearly every listed company reports within a few weeks of each quarter ending.
A: Annual earnings growth. Consistent annual EPS growth over the past three years, ideally 20% or better, with healthy return on equity. This filters out companies having a single lucky quarter.
N: New. A new product, a new management team, a new regulation that helps, a capacity expansion coming online, or a new high in the stock price. Big moves usually have a story behind them. In India this is often policy-driven: PLI schemes, defence indigenisation and infrastructure spending all created “N” factors for whole groups of stocks.
S: Supply and demand. O’Neil favoured stocks where demand clearly outstripped supply, visible in volume on up days. In India it is also worth looking at free float. A company with 75% promoter holding has relatively few shares in public hands, which can amplify moves both ways.
L: Leader or laggard. Buy the leader in a leading group, not the cheap laggard. This is relative strength in practice: the stock should be outperforming the market and most of its peers.
I: Institutional sponsorship. Some quality mutual funds, insurers or FPIs buying in, ideally increasing their holding over recent quarters. Shareholding patterns are filed quarterly, so this is easy to check. Too much ownership, though, means there are few new buyers left.
M: Market direction. O’Neil was blunt about this: most stocks follow the market. If the Nifty and broader indices are in a downtrend, even good CANSLIM stocks tend to struggle. Many of his followers simply go to cash when the market is in correction.
Where CANSLIM needs adapting for India
The thresholds come from US data, and Indian companies report differently in a few ways. Quarterly numbers can be lumpy for project-based businesses such as EPC, defence and capital goods, so a single weak quarter is not always a red flag. Look at trailing twelve-month trends as well.
Liquidity is the other big one. A smallcap can tick every fundamental box and still be a poor CANSLIM candidate if it trades only a few lakh rupees a day, because institutions cannot meaningfully buy it, and institutional demand is half the point.
Finally, the method is about buying growth leaders at the right moment, not just owning good companies. The chart still matters. O’Neil’s entries were breakouts from proper bases, such as cup-with-handle patterns, flat bases or VCP-style contractions, on strong volume.
Explore CANSLIM stocks on NSE
The Quantsgrow CANSLIM screener applies William O’Neil’s framework to Indian stocks. It looks for strong earnings and sales growth, new products or management, and market-leading stocks in leading sectors. Treat the list as a shortlist of fundamentally and technically strong names, then wait for a proper base and breakout before acting.
Explore CANSLIM stocks → Opens the live screener in the Quantsgrow app.Using a CANSLIM list well
The most common mistake is buying a CANSLIM stock simply because it is on the list. The screener tells you the business and the price trend are strong. It does not tell you whether today is a sensible entry. The stocks on the list that are sitting in a tight base near their highs are usually more actionable than ones that have just run 30% off a breakout.
The second mistake is ignoring the M. When the market is weak, the list gets shorter, and the stocks on it tend to break down too. That is the screener telling you something about the environment.
The third is holding through big losses. O’Neil’s rule was to cut any loss at 7 to 8% from the purchase price, without exception. Most CANSLIM traders adapt the number, but the discipline is the core of the method.
Frequently asked questions
What does CANSLIM stand for?
Current quarterly earnings, Annual earnings growth, New products or highs, Supply and demand, Leader or laggard, Institutional sponsorship, and Market direction. It is a stock selection method developed by William O’Neil, founder of Investor’s Business Daily.
Does CANSLIM work in the Indian stock market?
The principles of strong earnings growth, leadership, institutional buying and favourable market conditions apply in India. Thresholds and liquidity requirements may need adjusting, and lumpy quarterly results in some sectors require judgement.
What is a good EPS growth rate for CANSLIM?
O’Neil suggested at least 20 to 25% year-on-year growth in recent quarterly EPS, preferably accelerating, and around 20% or more annual growth over several years. Many investors treat these as guides rather than strict cut-offs.
What is the M in CANSLIM?
M stands for market direction. Because most stocks follow the general market, O’Neil advised buying aggressively only when the overall market is in a confirmed uptrend and being cautious or in cash during corrections.
Is CANSLIM for long-term investing or trading?
It sits in between. CANSLIM aims to catch major price moves in growth leaders, which can last months or years, but it uses strict loss-cutting rules and technical entries more typical of trading.
Bottom line
CANSLIM is demanding by design. Most stocks fail it most of the time, and that is the point. The ones that pass are businesses with real earnings momentum that the market is already rewarding. Combine the list with a sensible read of the market and a disciplined entry, and it remains one of the more complete frameworks a growth-focused trader can use. Its natural companions are momentum and all-time-high scans, which focus on the same leaders from a purely price-based angle.
This page is for educational purposes only and is not investment advice or a recommendation to buy or sell any security. Investments in the stock market are subject to market risks. Examples are illustrative and do not refer to any specific stock unless clearly stated. Please do your own research and consider your risk tolerance before making any investment decision.