

There is a deep instinct that a stock at an all-time high is expensive and a stock far below its high is cheap. The market does not care much about that instinct. Stocks making new all-time highs have, by definition, no one sitting on a loss above the current price waiting to break even. That absence of overhead supply is one of the main reasons leaders tend to keep leading.
This page covers what all-time high stocks really tell you, how they differ from 52-week highs, when a new high is a warning rather than a signal, and how to use an all-time high scan sensibly.
Why new highs matter
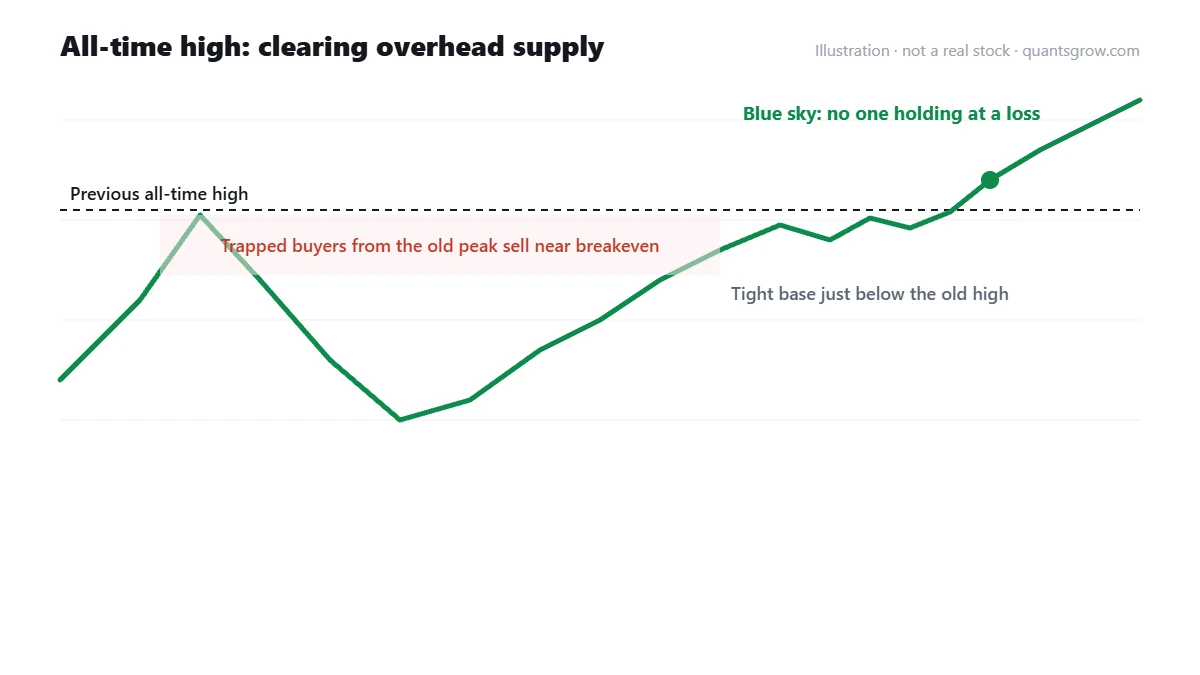
Picture a stock that peaked at ₹800 three years ago, fell to ₹450, and has slowly recovered to ₹780. Everyone who bought between ₹700 and ₹800 near the old top has been underwater for years. As the price approaches ₹800, many of them sell to get their money back. That is overhead supply, and it is why stocks often stall just below old highs.
Once the stock clears ₹800 decisively, that supply is gone. Every holder is in profit, and new buyers are paying prices nobody has paid before. Traders call this “blue sky” territory. It does not guarantee anything, but it removes one of the main obstacles a rally normally faces.
All-time highs versus 52-week highs
A 52-week high only looks back a year. A stock can be at a 52-week high and still sit 40% below a peak from 2021, with plenty of trapped holders above. An all-time high is a stronger statement: the stock has cleared every level of resistance in its history.
Both are useful, but they measure different things. A 52-week high list is broader and includes recovering stocks. An all-time high list is narrower and tends to be dominated by genuine leaders, the companies whose earnings have grown into a new valuation range.
Healthy new highs and dangerous ones
Healthy: the stock spent weeks or months building a base just under the old high, then broke through on clearly rising volume. The breakout came while the broader market was stable or improving. The company has the earnings to support the move.
Dangerous: the stock went nearly vertical into the new high, with several gap-ups in a row and volume exploding. It is far above its 50-day average. This kind of climax run often marks the end of a move rather than the start. It is the most common way traders lose money buying new highs.
The difference is usually visible on the chart. A breakout from a tight base gives you a nearby stop. A climax run gives you no logical place to be wrong except far below.
See which NSE stocks are at all-time highs
The Quantsgrow All Time High screener lists stocks making new all-time highs, breaking through historical resistance levels. It is a fast way to see where market leadership is concentrated on any given day. Filter by index and sort by sector to spot whole groups breaking out together.
View all-time high stocks → Opens the live screener in the Quantsgrow app.Reading the list as a market signal
The number of stocks making new highs is itself worth watching. When the Nifty rises but fewer and fewer stocks are making new highs, the rally is narrowing, and that often precedes trouble. When a correction ends and new highs start expanding across many sectors, it is usually a healthy sign.
Sector clustering matters too. If a dozen names from the same industry hit new highs in the same week, that is a group move, and group moves tend to last longer than a single stock’s breakout.
Practical rules for trading new highs
Buy near the breakout level rather than far above it. Use the top of the old base as a reference: if the stock closes back well inside the base, the breakout has failed. Keep an eye on the market. New-high strategies work best when the overall market is trending up, and much less well in choppy or falling markets.
Most importantly, do not short or sell stocks just because they are at all-time highs. “It’s gone up too much” is a feeling, not an analysis.
Frequently asked questions
Is it good to buy stocks at an all-time high?
It can be. Stocks at all-time highs have no overhead supply from trapped holders, which often lets strong stocks keep rising. The risk is buying after an extended, near-vertical move. Breakouts from a proper base near the old high are generally lower risk.
What is the difference between a 52-week high and an all-time high?
A 52-week high is the highest price in the past year. An all-time high is the highest price ever traded. A stock can be at a 52-week high while still far below its all-time high.
Why do stocks keep rising after all-time highs?
Because every holder is in profit, there are fewer sellers waiting to break even. If the underlying business is growing and institutions are buying, that lack of supply can let the trend continue.
How do I find stocks at all-time highs today?
Use a scan that compares each stock’s current price with its full trading history, such as the Quantsgrow All Time High screener. Review each chart for base quality and extension before acting.
The short version
New highs are a sign of strength, not a sell signal. The trick is distinguishing a stock breaking out of a well-built base from one making a final, exhausted lunge higher. Use the all-time high list to find leaders, combine it with relative strength and CANSLIM fundamentals to confirm them, and buy close to the breakout rather than far above it. For setups that form just before new highs, see high tight flags.
This page is for educational purposes only and is not investment advice or a recommendation to buy or sell any security. Investments in the stock market are subject to market risks. Examples are illustrative and do not refer to any specific stock unless clearly stated. Please do your own research and consider your risk tolerance before making any investment decision.