

One thing you notice after watching enough breakouts is that the best ones rarely look exciting beforehand. The stock stops making big swings. Each pullback is a little shallower than the last, volume quietly dries up, and for a few weeks it feels like nothing is happening. Then it moves.
That quiet phase is what traders call a VCP, or volatility contraction pattern. This page covers how VCP stocks in India actually behave on the chart, how to tell a genuine setup from a stock that is simply going sideways, and where the pattern tends to fail on NSE.
What a VCP looks like on a real chart
The idea comes from Mark Minervini, who described it in his books on trading stocks in strong uptrends. Strip away the jargon and it is a story about sellers running out.
A stock rallies hard, then pulls back. Early holders take profits, and the first correction is usually the deepest, often 15 to 30% for a midcap. Buyers step in, the stock recovers, and then it dips again. But this time the dip is smaller, because fewer people are left who want out. A third dip is smaller still. By the end, the stock is moving in a range of a few percent and volume on down days is noticeably lighter than it was a month ago.
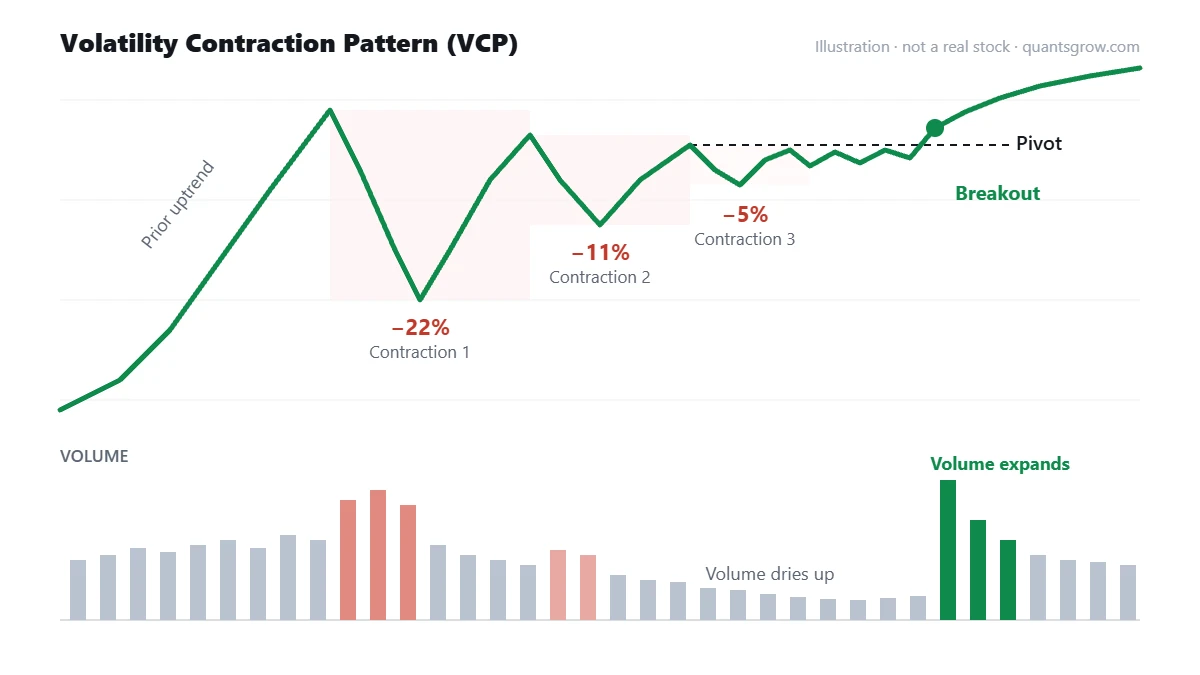
Each of those pullbacks is a “contraction”. Most clean VCPs show two to four of them. Fewer than two and you just have a pullback. Many more than four and the base is often getting too long and loose to trust.
Why volume matters more than the shape
Plenty of stocks draw something that looks like a VCP if you squint. What separates a real one is volume behaviour.
On the left side of the base, the sharp first pullback, you expect heavy volume. That is distribution, people selling. As the contractions tighten, daily volume should fall well below its 50-day average, sometimes to the lowest levels in months. That dry-up is the signal: the stock is barely moving and almost nobody is selling it. If a stock tightens in price but volume stays high, someone is still unloading, and the “tightness” is just a pause.
The breakout itself should come with a volume expansion. Traders differ on the exact number, but a breakout day at 1.5 to 2 times the 50-day average volume is a reasonable minimum. A breakout on average or below-average volume is a warning, not a confirmation.
What makes a VCP setup stronger, and what makes it weak
The pattern does not exist in isolation. A few things consistently separate the setups that follow through from the ones that fizzle.
The prior trend. A VCP is a continuation pattern. It belongs in a stock already trading above its rising 50-day and 200-day moving averages, ideally one that has outperformed the Nifty over the past few months. A “VCP” in a stock making lower lows is just a downtrend taking a breather.
Relative strength. The stocks that break out cleanly are usually ones that held up while the broader market wobbled. If the Nifty fell 6% during the base and your stock only gave up 3%, that is useful information. (We cover this separately in High RS stocks.)
Tightness of the final contraction. The last range before the pivot should be genuinely tight, often under 5 to 8% from high to low, with several days of small candles. That gives you a logical stop just below the range and keeps the risk small.
On the weak side, watch for wide, sloppy final ranges, contractions that do not actually get smaller, and bases where the right side sits far below the left-side high. Thin liquidity is another one that matters in India. A smallcap that trades ₹40 lakh a day can “break out” on a handful of orders and reverse just as easily.
VCP vs ordinary consolidation
Every VCP is a consolidation, but most consolidations are not VCPs. A stock that has moved between ₹480 and ₹540 for three months, with swings of roughly the same size and steady volume throughout, is consolidating. Nothing about it tells you supply is drying up.
The difference is direction of change. In a VCP the swings get progressively smaller and the volume progressively lighter. If you put the pullback depths side by side, say 22%, 11%, 6%, you should see the sequence shrink. A range that stays the same size is neutral. A range that is widening is usually a sign of trouble.
Confirming a VCP breakout
The pivot is the high of the final tight range. The breakout is a decisive close above it, and “decisive” is doing real work in that sentence. A few practical checks:
The close matters more than the intraday high. Stocks often poke above the pivot at 10:30 and give it all back by 3:30. Volume should expand clearly on the breakout day. And ideally the stock should not be extended far from the pivot when you enter. Buying a stock already 8% above its breakout point turns a tight, low-risk setup into an ordinary chase.
Indian markets add a few wrinkles. Stocks in the 5% or 10% price bands can hit the upper circuit on breakout day, which makes entry impossible at a sensible price. Stocks in the F&O ban period can behave oddly as positions unwind. And breakouts the week before quarterly results carry gap risk that has nothing to do with the pattern.
See which NSE stocks are forming VCPs right now
Scanning a few hundred charts by hand for shrinking pullbacks takes an evening. The Quantsgrow VCP screener runs that scan every day and lists the stocks currently meeting the setup criteria. You can filter by index (Nifty 50, Nifty 500, Midcap 150, Smallcap 250) and sort by relative strength, sector or recent returns, so you start from a shortlist instead of a blank screen.
View today’s VCP stocks → Opens the live screener in the Quantsgrow app.How to use a VCP screener without fooling yourself
A screener’s job is to narrow a universe of 2,000-odd listed stocks down to the few dozen worth a closer look. It is a starting point, not a buy list.
Once you have the shortlist, open each chart and check the things a scan cannot judge well. Does the base look orderly, or is the “contraction” an artefact of one strange candle? Is there news behind the tightness, such as a pending merger or a promoter pledge issue? Is the sector moving with it? A VCP in a stock whose entire sector is breaking down tends to struggle.
It also helps to cross-check with other scans. A stock that shows up in both the VCP list and the momentum stocks list is in a different position from one that only just squeaked into the VCP criteria. When a VCP finally resolves, it often appears on volume breakout scans the same day.
Risk management: where the pattern earns its keep
The real appeal of a VCP is not that it “works” more often than other setups. It is that the tight final range gives you a natural, nearby stop.
If the last contraction runs from ₹612 to ₹640 and you buy the breakout at ₹642, a stop just under ₹610 means about 5% risk on the position. If the trade works, the upside can be several times that. If it fails, the loss is small and defined. Size the position so that 5% move costs you a fixed, small slice of capital, commonly 0.5 to 1% of the account, rather than deciding the quantity first and the stop later.
Failed breakouts are part of the game. A breakout that closes back inside the base within a day or two is telling you something. Waiting for it to “come back” is how a 5% planned loss becomes a 20% one.
When not to trade a VCP
When the broader market is in a correction, most breakouts fail regardless of how good the base looks. If the Nifty and the midcap index are below their 50-day averages and falling, the number of VCPs on any screener drops sharply, and the ones that remain have poor odds. This is often a better time to build a watchlist than to buy.
Skip it, too, when the stock is illiquid, when results or a major corporate event are a few days away, or when you cannot place a stop at a sensible distance. A “VCP” whose last range is 15% wide is not giving you the low-risk entry the pattern is supposed to offer.
Common VCP mistakes
Buying before the breakout because the base “looks ready” is the most common one. Bases can tighten for weeks longer than you expect, or break down instead. Close behind it is ignoring volume and treating any tightening range as a VCP. Then there is chasing: entering a stock already well past its pivot because it showed up on a scan late in the day. And finally, holding a failed breakout because the setup looked so good. The pattern being good does not oblige the market to agree.
Frequently asked questions
What is a VCP in the stock market?
A VCP, or volatility contraction pattern, is a base that forms during an uptrend where each pullback is shallower than the last and trading volume declines. It signals that selling pressure is drying up. Traders typically buy when price breaks above the final tight range on higher volume.
How many contractions should a VCP have?
Most clean VCPs show two to four contractions. What matters more than the count is that each pullback is meaningfully smaller than the previous one and that the final range is tight.
Does the VCP pattern work in Indian markets?
The underlying logic of supply drying up before a breakout applies to NSE stocks as it does elsewhere. Indian markets do add practical issues, such as price bands, F&O ban periods and thin liquidity in smaller stocks, that you need to account for. Like any setup, it works better in a rising market than in a falling one.
What is a good stop-loss for a VCP breakout?
A common approach is to place the stop just below the low of the final contraction. Because that range is tight, the risk is usually 3 to 8%. If the stop would need to be much wider, the setup is probably not tight enough.
Can I find VCP stocks for free?
You can find them manually by scanning charts, which takes time. Screeners such as the Quantsgrow VCP screener do the first pass automatically and list stocks currently matching the criteria, after which you still need to review each chart yourself.
The short version
A VCP is a stock in an uptrend getting quieter: smaller pullbacks, lighter volume, a tight final range. The breakout on rising volume is the entry, and the low of that final range is the stop. Its strength is the small, defined risk, not any promise about the outcome. Use a screener to find candidates, use your own eyes to reject the weak ones, and respect the market environment before any of it.
If you are building a broader process, the setups that pair most naturally with VCPs are high relative strength stocks, breakout stocks and CANSLIM stocks, which add an earnings filter on top of the price action.
This page is for educational purposes only and is not investment advice or a recommendation to buy or sell any security. Investments in the stock market are subject to market risks. Examples are illustrative and do not refer to any specific stock. Please do your own research and consider your risk tolerance before making any investment decision.